We’ve been running a large-scale Kubernetes cluster on Scientific Linux 7 for years. It works. It’s stable. Nobody complains. So naturally, we decided to migrate everything to Debian 12.
I’m leading this migration at Automattic, and it involves moving over a thousand servers to a completely new OS stack. New kernel, new cgroup version, new assumptions about how your containers actually use resources. The goal is straightforward: modern infrastructure, better tooling, fewer surprises down the road.
The surprises showed up immediately.
The Problem Nobody Warns You About
cgroups are the Linux kernel feature that controls and limits how much CPU, memory, and other resources a process can use.
Here’s the thing about cgroup v1 (the old way): CPU limits are soft. If your container says it needs 2 CPUs but the host has 16 CPUs sitting idle, the kernel lets your container burst way past its limit. Everyone’s happy. Your monitoring looks clean. Your apps run fine.
cgroup v2 (the new way) doesn’t do that. CPU limits are hard. You asked for 2 CPUs? You get 2 CPUs. Doesn’t matter if the host is 80% idle. The CFS quota enforcer will throttle your container the moment it tries to exceed its allocation.
This distinction matters a lot more than it sounds like.

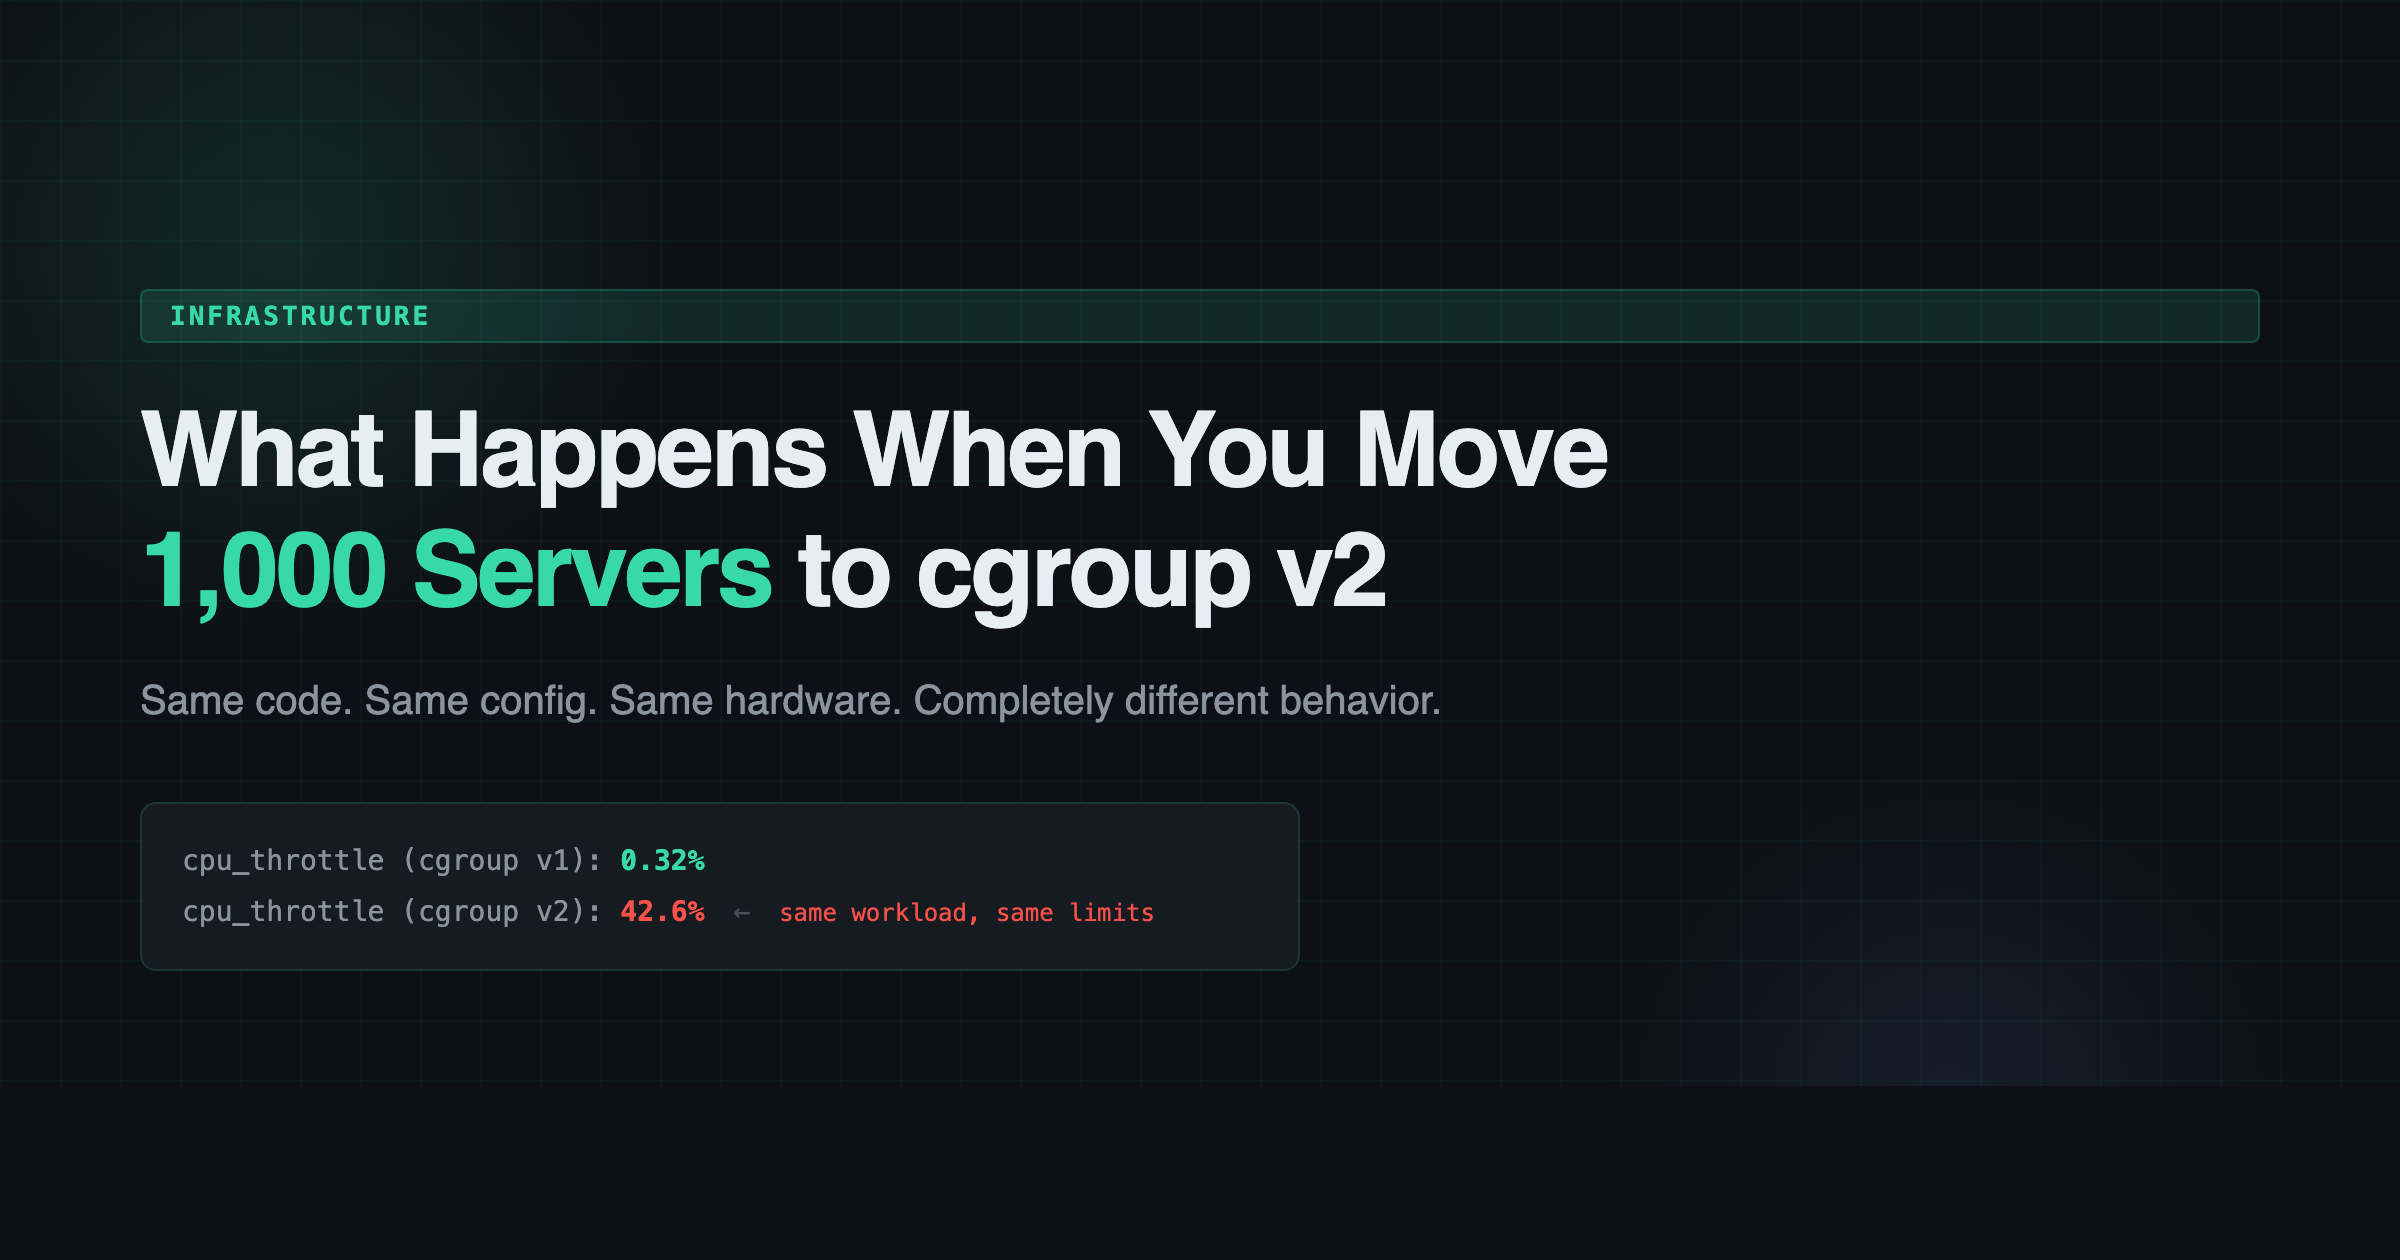
0.32% to 42.6%
We had an nginx ingress controller handling external traffic for hundreds of millions of requests. The config was simple: 4 nginx workers, 2 CPU limit. On Scientific Linux 7, the throttle rate was 0.32%. Basically nothing. Health checks passed. Latency was fine. Life was good.
On Debian 12 with cgroup v2, the same config produced a 42.6% throttle rate. The host CPU was 76.9% idle. Plenty of headroom. But the container couldn’t touch it.
Here’s what happened in sequence:
- 4 nginx workers competing for 2 CPUs worth of quota
- Workers hit the CFS bandwidth limit and get throttled
- Throttled workers can’t call
accept()fast enough - TCP listen backlog (default 511) overflows
- Kernel starts dropping SYN packets
- Health checks time out
- Pod restarts
Same code. Same config. Same hardware. Completely different behavior.
It Wasn’t Just Nginx
Once we started looking, the pattern was everywhere. Workloads that had been “fine” for years were suddenly gasping for air:
- A core platform service: 99% throttled
- A search task manager: 100% throttled in prod, 99% in dev
- A log pruning job: 100% throttled
- Stream processing workers: 97-100% at their memory limits
- Various sidecars (auth proxies, metrics exporters): 95-100% memory utilization
None of these had ever raised an alert on Scientific Linux 7. They were all quietly bursting past their stated limits, and nobody knew because nobody had a reason to look.
The Fix
The fix itself is boring. Bump the CPU limit to match the actual workload. For the nginx ingress, we went from 2 to 8 CPUs (2 per worker). Throttle rate dropped to 0.4%. Health checks passed. Done.
The interesting part is the discovery process. You can’t just do a blanket “double all the limits” because some workloads genuinely don’t need more. You have to look at each one, understand what it’s actually doing, and set appropriate limits based on real usage instead of inherited guesses from three years ago.
We ended up writing a tracker script that generates tab-separated output we could paste into a spreadsheet. For each workload: current CPU request, current limit, actual throttle rate, memory utilization. Sort by throttle rate descending. Start at the top and work your way down.
The Lesson
If you’re planning a migration from an older Linux distribution to something running cgroup v2 (which is basically everything modern at this point: Debian 12+, Ubuntu 22.04+, Fedora, RHEL 9), here’s what I’d tell you:
Audit your resource limits before you migrate, not after. Every container that’s been happily bursting on cgroup v1 is going to get a rude awakening on v2. The workload hasn’t changed. The enforcement has.
Run something like this on your current cluster:
# Check container CPU throttle rateskubectl top pods --containers -A | sort -k4 -rn | head -20Or better yet, if you have Prometheus:
rate(container_cpu_cfs_throttled_periods_total[5m])/rate(container_cpu_cfs_periods_total[5m])* 100Anything above 10-15% is a candidate for a limit bump. Anything above 50% is going to have a bad time on cgroup v2.
The Bigger Picture
This was just one of the problems we hit during the migration. There were kernel regressions that spawned 8,000+ kworkers and pegged a node at load 8,235 for 46 minutes. There were firewall rule asymmetries that broke cross-node metrics scraping. There were StatefulSet race conditions where Kubernetes would grab the wrong persistent volume if you weren’t fast enough.
Each one of those is its own story. But the cgroup v2 throttling issue is the one I think most people will run into first, and it’s the easiest to miss because everything looks fine until it suddenly doesn’t.
The migration is still ongoing. Over a thousand servers, hundreds of stateful workloads, and a lot of tar pipes between machines that can’t SSH to each other. I’ll write more about it as we go.
If you’re doing something similar, I’d love to hear about it. Hit me up on Twitter/X or LinkedIn.
Leave a Reply